Week 6: Spreadsheets & Databases
Part One: Lesson Ideas with Spreadsheet Software
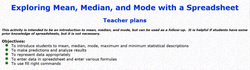
Exploring Mean, Median and Mode with a Spreadsheet
This lesson is a great introduction to the basic statistical concepts of mean, median and mode. Most high school math students have been exposed to these computations before but they need a review of them during a statistics or math analysis course. This activity asks students to collect data from their classmates and analyze it using a spreadsheet. Practicing using mean, median and mode in an interactive activity such as this engages students and makes the learning process more enjoyable.
This lesson is a great introduction to the basic statistical concepts of mean, median and mode. Most high school math students have been exposed to these computations before but they need a review of them during a statistics or math analysis course. This activity asks students to collect data from their classmates and analyze it using a spreadsheet. Practicing using mean, median and mode in an interactive activity such as this engages students and makes the learning process more enjoyable.
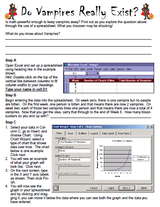
Do Vampires Really Exist?
PreCalculus students are expected to learn about exponential functions. There are many real world scenarios that exponential functions apply to. This project is an unrealistic example but it is fun, entertaining and the concept is the same as real world examples. Students use a spreadsheet to record the numbers of vampires that "exist" in the world, what they discover is that they have created an exponential function and graph in the spreadsheet. By using this activity, students are exposed to evaluating exponential functions and graphing this data. This foundation is a great introduction to a difficult topic and helps students visualize the material.
PreCalculus students are expected to learn about exponential functions. There are many real world scenarios that exponential functions apply to. This project is an unrealistic example but it is fun, entertaining and the concept is the same as real world examples. Students use a spreadsheet to record the numbers of vampires that "exist" in the world, what they discover is that they have created an exponential function and graph in the spreadsheet. By using this activity, students are exposed to evaluating exponential functions and graphing this data. This foundation is a great introduction to a difficult topic and helps students visualize the material.
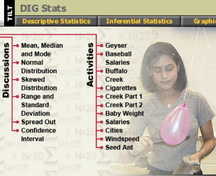
DIGS Statistics: Standard Deviation of Temperature Data
Statistics is a subject that relies on numerical data and its analysis. This subject lends itself perfectly to the use of spreadsheet software because data can be easily input, charts can be easily graphed, and computations can be easily calculated. The DIGS Statistics website offers several lessons that involve the use of a spreadsheet. These lessons introduce or reinforce statistical concepts such as mean, median, mode, standard deviation, variance, confidence interval, range and distribution. This particular lesson focuses on the standard deviation of temperatures in U.S. cities. This is a great activity because it uses real data and it applies the concept to a real world application.
Statistics is a subject that relies on numerical data and its analysis. This subject lends itself perfectly to the use of spreadsheet software because data can be easily input, charts can be easily graphed, and computations can be easily calculated. The DIGS Statistics website offers several lessons that involve the use of a spreadsheet. These lessons introduce or reinforce statistical concepts such as mean, median, mode, standard deviation, variance, confidence interval, range and distribution. This particular lesson focuses on the standard deviation of temperatures in U.S. cities. This is a great activity because it uses real data and it applies the concept to a real world application.
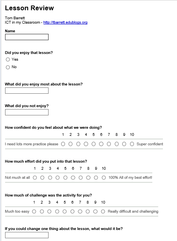
Google Form Data Collection Spreadsheets
There are many lesson ideas available for applying the use of spreadsheets into a math or statistics class. However, I found this website particularly interesting because it offers many ideas for the use of a spreadsheet into any classroom. These applications are extremely useful for any educator. For example, most teachers have students fill out a questionnaire at the beginning of a course in order to get to know them better. I used to do this with my students as well; I would ask questions about their interests, concerns and past math classes/grades. Using a Google form for this questionnaire would help me organize their responses into a spreadsheet. Another great idea is to use a spreadsheet to evaluate a learning activity. Students can respond with positive or constructive feedback in regards to the implementation of a project or activity.
There are many lesson ideas available for applying the use of spreadsheets into a math or statistics class. However, I found this website particularly interesting because it offers many ideas for the use of a spreadsheet into any classroom. These applications are extremely useful for any educator. For example, most teachers have students fill out a questionnaire at the beginning of a course in order to get to know them better. I used to do this with my students as well; I would ask questions about their interests, concerns and past math classes/grades. Using a Google form for this questionnaire would help me organize their responses into a spreadsheet. Another great idea is to use a spreadsheet to evaluate a learning activity. Students can respond with positive or constructive feedback in regards to the implementation of a project or activity.
Part Two: Sample Spreadsheet Lesson Framework
Lesson Topic: The Unit Circle and Graphing Trigonometric Functions
Content Area: Algebra 3, Trigonometry or PreCalculus
Grade Level: 10-12
Description of Topic:
The unit circle is an invaluable tool for any trigonometry student. However, most students don’t understand the significance of the details in this incredible instrument. The unit circle is a circle with a radius of 1. Each coordinate that lies on the circle represents trigonometric values at that angle. Specifically, the x-coordinate at each angle represents the cosine value and the y-value represents the sine value. Furthermore, the slope of the tangent line at each point lying on the circle represents the tangent value at that angle. Since secant, cosecant and cotangent are all reciprocal trigonometric function, someone can evaluate all six trig functions of any angle using the unit circle.
Course Objectives:
California State Educational Standards for [Mathematics]:
Trigonometry Subject Standard 2.0 Students know the definition of sine and cosine as y-and x-coordinates of points on the unit circle and are familiar with the graphs of
the sine and cosine functions.
Lesson Framework:
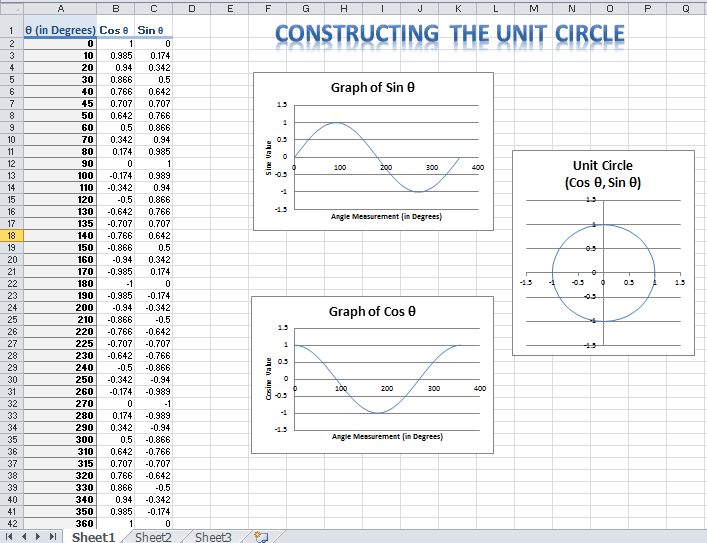
Students will be given the spreadsheet framework for this instructional activity, which consists of 3 columns. The first column will be titled θ to represent the angle measurement in degrees. The next two columns are designated for students to input the cosine and sine values, respectively, at those angles by using their calculator and rounding to three decimal places. Once students have completed columns 2 and 3, they will be asked to make three charts. The first should be a scatter plot graph with smooth curves that represents the cosine value at each given angle. The second should be a scatter plot graph with smooth curves that represents the sine value at each given angle. The last graph should be a scatter plot that uses the cosine values as the x-coordinates and the sine values as the y-coordinates.
Once this activity is completed, the class will participate in a discussion about the graphs that were created and what they represent. Students should hopefully connect the trigonometric function values with the angles created within the circle. Students will discuss these angle values in both degree and radian measure. There will also be some discussion about the significance of the values .5, .707, and .866 when they are represented in a rational form.
The lesson has great potential for students to gain a visual perspective of a difficult concept. The unit circle is too often given to students to memorize without any real explanation of what the values represent. Furthermore, this activity introduces students to more than the unit circle; students are also introduced to graphing trigonometric functions. The domain, period, amplitude and range of trigonometric function will be discussed in later lessons. This introduction gives students a great foundation for these subsequent lessons. A different spreadsheet can be used later when students are learning how to graph the other four trig functions: tangent, secant, cosecant, and cotangent.
Content Area: Algebra 3, Trigonometry or PreCalculus
Grade Level: 10-12
Description of Topic:
The unit circle is an invaluable tool for any trigonometry student. However, most students don’t understand the significance of the details in this incredible instrument. The unit circle is a circle with a radius of 1. Each coordinate that lies on the circle represents trigonometric values at that angle. Specifically, the x-coordinate at each angle represents the cosine value and the y-value represents the sine value. Furthermore, the slope of the tangent line at each point lying on the circle represents the tangent value at that angle. Since secant, cosecant and cotangent are all reciprocal trigonometric function, someone can evaluate all six trig functions of any angle using the unit circle.
Course Objectives:
- Identify a unit circle and describe its relationship to real numbers
- Evaluate trigonometric functions using a unit circle
- Use the domain and period to evaluate sine and cosine functions
- Use a calculator to evaluate trig functions
- Sketch the graphs of basic sine and cosine functions
California State Educational Standards for [Mathematics]:
Trigonometry Subject Standard 2.0 Students know the definition of sine and cosine as y-and x-coordinates of points on the unit circle and are familiar with the graphs of
the sine and cosine functions.
Lesson Framework:
Students will be given the spreadsheet framework for this instructional activity, which consists of 3 columns. The first column will be titled θ to represent the angle measurement in degrees. The next two columns are designated for students to input the cosine and sine values, respectively, at those angles by using their calculator and rounding to three decimal places. Once students have completed columns 2 and 3, they will be asked to make three charts. The first should be a scatter plot graph with smooth curves that represents the cosine value at each given angle. The second should be a scatter plot graph with smooth curves that represents the sine value at each given angle. The last graph should be a scatter plot that uses the cosine values as the x-coordinates and the sine values as the y-coordinates.
Once this activity is completed, the class will participate in a discussion about the graphs that were created and what they represent. Students should hopefully connect the trigonometric function values with the angles created within the circle. Students will discuss these angle values in both degree and radian measure. There will also be some discussion about the significance of the values .5, .707, and .866 when they are represented in a rational form.
The lesson has great potential for students to gain a visual perspective of a difficult concept. The unit circle is too often given to students to memorize without any real explanation of what the values represent. Furthermore, this activity introduces students to more than the unit circle; students are also introduced to graphing trigonometric functions. The domain, period, amplitude and range of trigonometric function will be discussed in later lessons. This introduction gives students a great foundation for these subsequent lessons. A different spreadsheet can be used later when students are learning how to graph the other four trig functions: tangent, secant, cosecant, and cotangent.
| unit_circle_spreadsheet.xlsx |
| unit_circle_spreadsheet_blank.xlsx |
AECT Standards achieved: 1.3 Instructional Strategies, 2.1 Print Technologies, 2.3 Computer-Based Technologies, 3.1 Media Utilization, 3.2 Diffusion of Innovations
